phuryn
Install Metrics Dashboard
Pick your agent. Every command is ready to paste.
npx skills add phuryn/pm-skills --skill metrics-dashboardThe open skills CLI detects your agents (Claude Code, Cursor, Codex and 70+ more) and installs to the right folder. Add -g to install globally.
01
Install it
Run the command above, or upload the folder in Claude.
02
Ask naturally
Describe the task. Your agent loads metrics-dashboard when the request matches its description.
03
Name it if needed
If it does not trigger, say “use the metrics-dashboard skill”. In Codex, type $metrics-dashboard.
Product Metrics Dashboard
Design a comprehensive product metrics dashboard with the right metrics, visualizations, and alert thresholds.
Context
You are designing a metrics dashboard for $ARGUMENTS.
If the user provides files (existing dashboards, analytics data, OKRs, or strategy docs), read them first.
Domain Context
Metrics vs KPIs vs NSM: Metrics = all measurable things. KPIs = a few key quantitative metrics tracked over a longer period. North Star Metric = a single customer-centric KPI that is a leading indicator of business success.
4 criteria for a good metric (Ben Yoskovitz, Lean Analytics): (1) Understandable — creates a common language. (2) Comparative — over time, not a snapshot. (3) Ratio or Rate — more revealing than whole numbers. (4) Behavior-changing — the Golden Rule: "If a metric won't change how you behave, it's a bad metric."
8 metric types: Vanity vs Actionable (only actionable metrics change behavior), Qualitative vs Quantitative (WHAT vs WHY — you need both; never stop talking to customers), Exploratory vs Reporting (explore data to uncover unexpected insights), Lagging vs Leading (leading indicators enable faster learning cycles, e.g. customer complaints predict churn).
5 action steps: (1) Audit metrics against the 4 good-metric criteria. (2) Update dashboards — ensure all key metrics are good ones. (3) Identify vanity metrics — be careful how you use them. (4) Classify leading vs lagging indicators. (5) Pick one problem and dig deep into the data.
For case studies and more detail: Are You Tracking the Right Metrics? by Ben Yoskovitz
Instructions
Identify the metrics framework — organize metrics into layers:
North Star Metric: The single metric that best captures core value delivery
Input Metrics (3-5): The levers that drive the North Star
Health Metrics: Guardrails that ensure overall product health
Business Metrics: Revenue, cost, and unit economics
For each metric, define:
Metric Definition Data Source Visualization Target Alert Threshold [Name] [Exact calculation: numerator/denominator, time window] [Where the data comes from] [Line chart / Bar / Number / Funnel] [Goal value] [When to trigger an alert] Design the dashboard layout:
┌─────────────────────────────────────────────┐
│  NORTH STAR: [Metric] — [Current Value]     │
│  Trend: [↑/↓ X% vs last period]             │
├──────────────────┬──────────────────────────┤
│  Input Metric 1  │  Input Metric 2          │
│  [Sparkline]     │  [Sparkline]             │
├──────────────────┼──────────────────────────┤
│  Input Metric 3  │  Input Metric 4          │
│  [Sparkline]     │  [Sparkline]             │
├──────────────────┴──────────────────────────┤
│  HEALTH: [Latency] [Error Rate] [NPS]       │
├─────────────────────────────────────────────┤
│  BUSINESS: [MRR] [CAC] [LTV] [Churn]        │
└─────────────────────────────────────────────┘
Set review cadence:
- Daily: Operational health (errors, latency, critical flows)
- Weekly: Input metrics and engagement trends
- Monthly: North Star, business metrics, OKR progress
- Quarterly: Strategic review and metric recalibration
Define alerts:
- What thresholds trigger investigation?
- Who gets alerted and through what channel?
- What's the expected response time?
Recommend tools based on the user's context:
- Amplitude, Mixpanel, PostHog for product analytics
- Looker, Metabase, Mode for SQL-based dashboards
- Datadog, Grafana for operational health
Think step by step. Save the dashboard specification as a markdown document.
Further Reading
- The Ultimate List of Product Metrics
- The North Star Framework 101
- The Product Analytics Playbook: AARRR, HEART, Cohorts & Funnels for PMs
- AARRR (Pirate) Metrics: The 5-Stage Framework for Growth
- The Google HEART Framework: Your Guide to Measuring User-Centric Success
- Funnel Analysis 101: How to Track and Optimize Your User Journey
- Are You Tracking the Right Metrics?
- Continuous Product Discovery Masterclass (CPDM) (video course)
Tips for Metrics Dashboard
- • Start a fresh session after installing so your agent picks up the new skill.
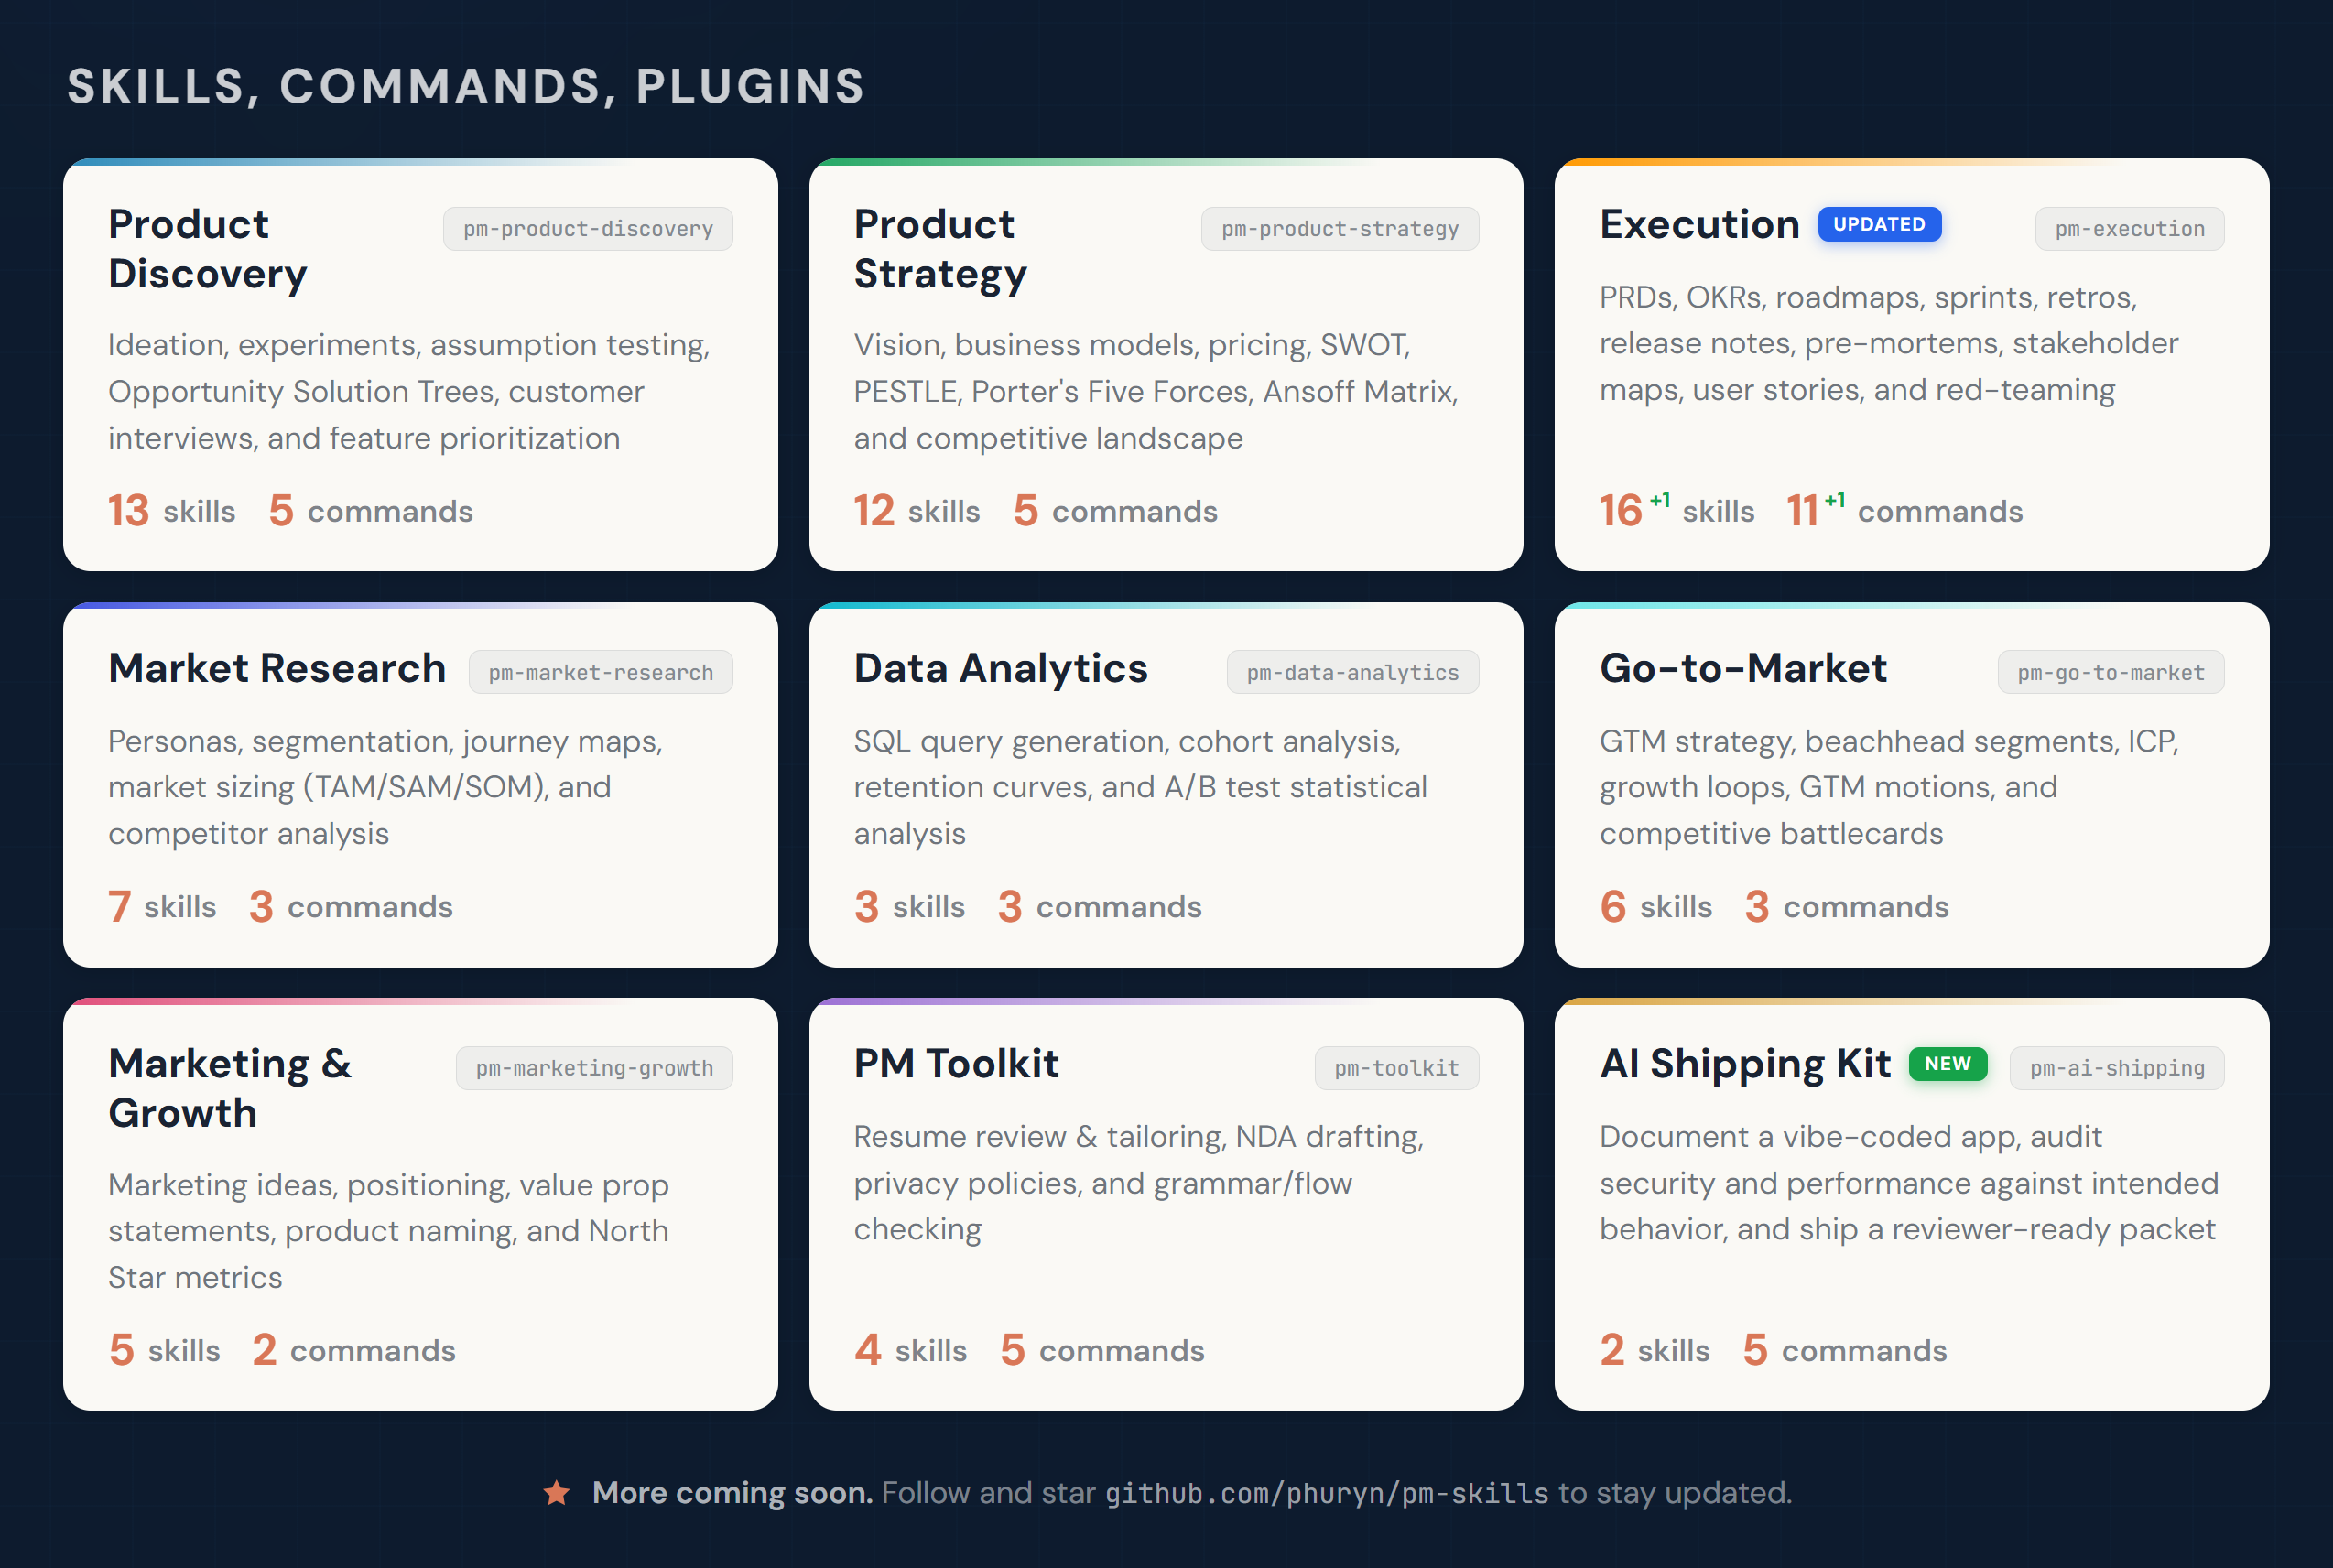
- • It is part of a pack with 72 skills. Install only the ones you need with --skill to keep triggers precise.
- • If two skills overlap, mention the one you want by name.
Questions about Metrics Dashboard
What does the Metrics Dashboard skill do?
Define and design a product metrics dashboard with key metrics, data sources, visualization types, and alert thresholds. Use when creating a metrics dashboard, defining KPIs, setting up product analytics, or building a data monitoring plan.
How do I install Metrics Dashboard?
Run "npx skills add phuryn/pm-skills --skill metrics-dashboard" in your project. The skills CLI installs it for Claude Code, Cursor, Codex and 70+ other agents. In Claude on the web, upload the skill folder as a ZIP under Customize > Skills.
Does Metrics Dashboard work in Cursor and Codex?
Yes. Metrics Dashboard uses the open SKILL.md format, so it works in Claude Code, Claude, Cursor, OpenAI Codex, Gemini CLI, GitHub Copilot and other agents that support agent skills.
Is Metrics Dashboard free?
Metrics Dashboard is open source on GitHub under the MIT license. It is free to install; check the license before commercial use.
Who made Metrics Dashboard?
Metrics Dashboard is published by phuryn in the phuryn/pm-skills repository, together with 71 other skills.