plugin87
Install Data Dashboard
Pick your agent. Every command is ready to paste.
npx skills add plugin87/ux-ui-agent-skills --skill data-dashboardThe open skills CLI detects your agents (Claude Code, Cursor, Codex and 70+ more) and installs to the right folder. Add -g to install globally.
01
Install it
Run the command above, or upload the folder in Claude.
02
Ask naturally
Describe the task. Your agent loads data-dashboard when the request matches its description.
03
Name it if needed
If it does not trigger, say “use the data-dashboard skill”. In Codex, type $data-dashboard.
The skill itself
SKILL.md
Skill: Data dashboard
Requirements
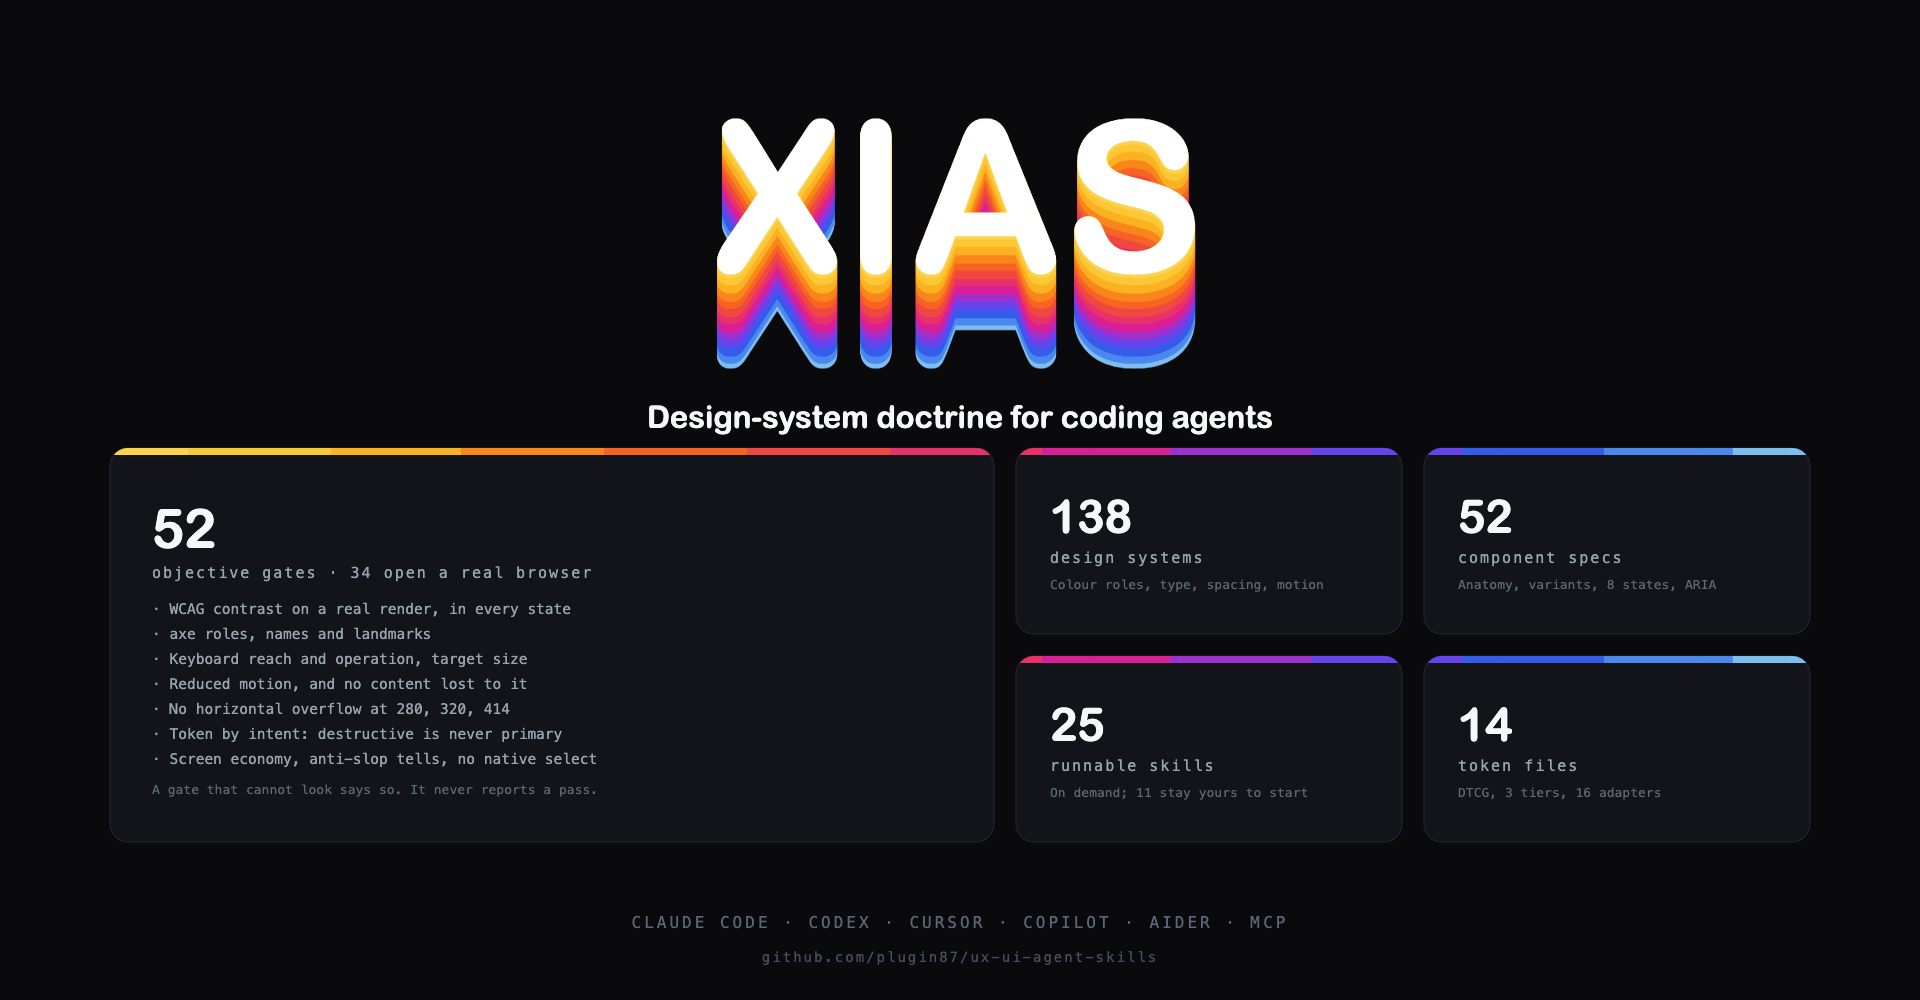
This skill needs the full UX/UI Agent Skills kit: the gates, the references and
the design-system library. Install it with npx ux-ui-agent-skills@3.1.0 init
or as the Claude Code plugin. npx skills@1.7.6 add copies the skill folder and
nothing else. Installed that way, this skill runs in guidance-only mode: no gate
runs, so it gives no verdict.
Step 0: is the kit here? Check once:
ls ${CLAUDE_SKILL_DIR}/../../../tokens >/dev/null 2>&1 && echo KIT_OK || echo KIT_MISSINGOnKIT_MISSING, open your reply with: "Guidance-only mode: the UX/UI Agent Skills kit is not installed here, so no gate ran and nothing below is measured." Then work from this file and general practice, under three rules. Do not guess or cite the contents of a kit file you could not open. State no measured number (no contrast ratio, no N/N, no "passes WCAG"): write "not verified" where one would go. End with a lineSkipped (kit not installed):that names every gate script this file tells you to run, then the install command above.
A dashboard is the hardest screen to keep honest: it is dense, it is mostly
non-text, and almost every default makes it worse. This is the recipe that
produced ${CLAUDE_SKILL_DIR}/../../../examples/showcase/ and ${CLAUDE_SKILL_DIR}/../../../examples/terminal/, both of which pass every
gate in both themes.
1. Decide the brief before drawing anything
Answer these in one line each, or /grill-me them out of the user:
- Who reads this, and what decision do they make from it? A revenue console for an operator and a trading desk for a dealer look nothing alike.
- What is the one number that leads? A dashboard without a lead is a wall.
- What is the update cadence? Hourly figures get a "last run" line. Live figures get a tape and a timestamp per row.
- How dense is honest? A terminal earns 12 panels. A weekly report does not.
2. Layout sequence, not a grid of equal cards
Four equal stat cards is the single loudest tell that nobody designed this. Compose in bands, each a different shape:
| Band | Content | Why |
|---|---|---|
| 1 | Hero metric at 3x body size + its own chart, spanning most of the width | The eye lands once |
| 2 | Two or three secondary figures, stacked or narrow | Quiet by construction |
| 3 | Three different chart shapes side by side (donut, ranked bars, sparklines) | Variety reads as intent |
| 4 | A table that really sorts, plus a feed or log | Detail after summary |
| 5 | A footer line that ends the page | A page must end on purpose |
Use a 12-column grid with explicit spans (span 8 / span 4), collapsing to 6
then 1. Never repeat(auto-fit, …) for the primary bands - it produces exactly
the equal-card wall you are avoiding.
3. The chart inventory
All of these are plain inline SVG with viewBox, sized by CSS, filled from
--color-chart-*. No chart library, no runtime dependency.
| Chart | Geometry | Use it for |
|---|---|---|
| Bar / column | <rect> per bucket, rx for a soft corner |
Discrete periods |
| Candlestick | <line> wick + <rect> body per period, class by up/down |
OHLC price |
| Volume | Bars under the price chart, same x-scale, opacity:.45 |
Conviction behind a move |
| Moving average | <polyline> over the candles, 2px, round joins |
Trend through noise |
| Line / sparkline | <polyline>, pathLength="1" for a draw animation |
Trend in a cell |
| Area / stacked area | <path> per band: forward along the top, reverse along the previous baseline, close |
Composition over time |
| Depth | Two cumulative area paths mirrored around the mid | Book liquidity |
| Waterfall | Floating <rect> per step + dashed connectors between levels |
Attribution |
| Donut | <circle> with stroke-dasharray and rotate() per segment |
Share of a whole, 3-5 slices |
| Radial gauge | Same trick, stroke-linecap:round, 270-degree sweep |
One value against a limit |
| Scatter / bubble | <circle>, radius = third dimension |
Two measures plus weight |
| Correlation matrix | HTML table, cell tint via color-mix |
Pairwise relationships |
| Heatmap | HTML table or <rect> grid, tint by value |
Cohorts, calendars |
| Order book | HTML table with a depth bar per row | Bids and asks |
Generate the geometry, do not hand-place it. Write a small deterministic script (a seeded walk) that emits the SVG elements, then paste the output in. Hand-typed coordinates drift and cannot be regenerated.
4. Domain correctness is part of craft
Gates cannot catch a chart that is drawn beautifully and means nothing. Check by hand:
- A correlation matrix is symmetric and its diagonal is exactly 1. Random values in both triangles is an instant tell to anyone who reads one for a living.
- A stacked area sums to the total; bands must not cross or leave gaps. The usual bug is reversing the baseline by index instead of by coordinate, which shows as dark wedges between bands.
- A waterfall needs connectors, and the closing bar must equal opening plus the steps.
- Depth rises away from the mid on both sides; it never falls.
- A donut whose segments do not total the whole is a pie chart lying.
5. Accessibility contract, per chart
- Every SVG gets
role="img"plus eitheraria-labelor<title>+<desc>referenced byaria-labelledby. Say what the chart shows, not that it is a chart: "Range 182.06 to 200.10, closing at 187.84" beats "price chart". - Never encode meaning in colour alone. Green with a
+and an arrow; red with a-. Up and down also carry a word in the table cell. - Tables get
<caption>(use.sr-onlywhen the panel header already says it),scope="col"/scope="row", andaria-sortonly if clicking really sorts. - Sortable headers, range tabs and theme toggles all declare state - so they must
change it on a real click.
verify_interactive.mjsclicks them and checks.
6. The traps that only appear when you measure
Every one of these was found on a screen that looked finished. The first group a gate caught; the ones marked "no gate sees it" were caught by opening the screenshot and looking, which is why that step is not optional:
- A chart palette is not a text palette. White initials on
--color-chart-4measured 2.65:1 in dark. Chart colours are tuned for large filled shapes. - Success green as text on a raised surface measured 4.43:1 - four hundredths short of AA. Put the colour on the icon and the sign; keep the text neutral.
- axe must not run mid-transition. Disable transitions before flipping the theme, or contrast is sampled while colours are still moving.
- Dense tables do not fit a phone. Drop the column a phone can lose - the sparkline, the derived value - in a media query, and say so in a comment. Do not shrink type below the scale.
- Stagger comes from a token:
calc(var(--duration-fast) * 0.6 * n), never a typed millisecond. - A grid row stretches its items. Two fields side by side where only one has
a hint: the hint-less control grows to match the taller column and the two
inputs end up different heights. Set
align-content: starton the field and an explicitblock-sizeon the control. Measure the heights in the render - the difference is obvious in a screenshot and invisible in the markup. - The same stretch hits whole panels, and no gate sees it. A row is as tall as
its tallest panel, and the short one packs its content to the top and ends in a
bordered void - a heatmap panel with 130px of nothing under the caption, a right
column that stops two panels short of the map beside it. Every panel in a row
has to say which it is: one child absorbs the slack
(
grid-template-rows:auto minmax(0,1fr), and that child's own tracks gominmax(<min>,1fr)so its rows grow too), or the rows share it out (align-content:space-between), or the short column earns another panel. Screenshot the row and look at the bottom edge of each panel; this never shows up in the markup. auto-fitsilently drops a column, and no gate sees it. Three gauges in a panel about 340px wide withminmax(min(100%,7rem),1fr)resolved to two tracks and orphaned the third beside an empty cell. When the count is fixed and meaningful, writerepeat(3,minmax(0,1fr))and give narrow widths their own rule.- A category chart needs its categories on the page, and no gate sees it. A
Pareto of five defect types whose names live only in the
aria-labelis a row of anonymous bars to everyone looking at it. Put the labels under the bars - lay the plot out on an even pitch inside its viewBox so a matching grid of labels lines up without a second coordinate system. - An
.sr-onlyneeds a positioned ancestor. Inside a scroller it otherwise resolves against the initial containing block, lands outside the viewport, and inflates the document's scroll width by hundreds of pixels. - A zero-area element that only has area while it animates reads as content
lost under
prefers-reduced-motion. Give a radar sweep a wedge, not a 1px line. - Never reuse a class name across layout and colour.
.c4as both a four-column span and the fourth chart colour painted an entire panel pink.
7. The loop
node ${CLAUDE_SKILL_DIR}/../../../scripts/gate.mjs measure_render.mjs <file> && node ${CLAUDE_SKILL_DIR}/../../../scripts/gate.mjs measure_render.mjs --dark <file>
node ${CLAUDE_SKILL_DIR}/../../../scripts/gate.mjs verify_states.mjs <file>  && node ${CLAUDE_SKILL_DIR}/../../../scripts/gate.mjs axe_audit.mjs --dark <file>
node ${CLAUDE_SKILL_DIR}/../../../scripts/gate.mjs verify_responsive.mjs <file> --scale=1.25
node ${CLAUDE_SKILL_DIR}/../../../scripts/gate.mjs verify_interactive.mjs <file>
DS_REQUIRE_BROWSER=1 node ${CLAUDE_SKILL_DIR}/../../../scripts/slop_tells.mjs --strict <file> && DS_REQUIRE_BROWSER=1 node ${CLAUDE_SKILL_DIR}/../../../scripts/taste_audit.mjs --strict <file>
Then screenshot it and look, in both themes, at 1600 and 390 wide. The gates will pass a chart that is drawn wrong. A correlation matrix that is not symmetric is 16/16 green and still embarrassing.
Worked references, both gate-verified: ${CLAUDE_SKILL_DIR}/../../../examples/showcase/index.html (revenue
console) and ${CLAUDE_SKILL_DIR}/../../../examples/terminal/index.html (trading desk, ten chart types).
Tips for Data Dashboard
- • Start a fresh session after installing so your agent picks up the new skill.
- • It is part of a pack with 26 skills. Install only the ones you need with --skill to keep triggers precise.
- • If two skills overlap, mention the one you want by name.
Questions about Data Dashboard
What does the Data Dashboard skill do?
Build a dense, data-heavy screen - an analytics console or a trading terminal - with real charts drawn from tokens: candlestick, volume, depth, stacked area, waterfall, scatter, correlation matrix, donut, gauge, sparklines, heatmaps and order books. Use when the request is a dashboard, terminal, monitoring view, data console, or any screen whose job is to show many numbers at once. Covers the layout sequence, the SVG geometry, the accessibility contract per chart type, and the contrast traps that only appear in dark mode.
How do I install Data Dashboard?
Run "npx skills add plugin87/ux-ui-agent-skills --skill data-dashboard" in your project. The skills CLI installs it for Claude Code, Cursor, Codex and 70+ other agents. In Claude on the web, upload the skill folder as a ZIP under Customize > Skills.
Does Data Dashboard work in Cursor and Codex?
Yes. Data Dashboard uses the open SKILL.md format, so it works in Claude Code, Claude, Cursor, OpenAI Codex, Gemini CLI, GitHub Copilot and other agents that support agent skills.
Is Data Dashboard free?
Data Dashboard is open source on GitHub under the MIT license. It is free to install; check the license before commercial use.
Who made Data Dashboard?
Data Dashboard is published by plugin87 in the plugin87/ux-ui-agent-skills repository, together with 25 other skills.